Hey ![]()
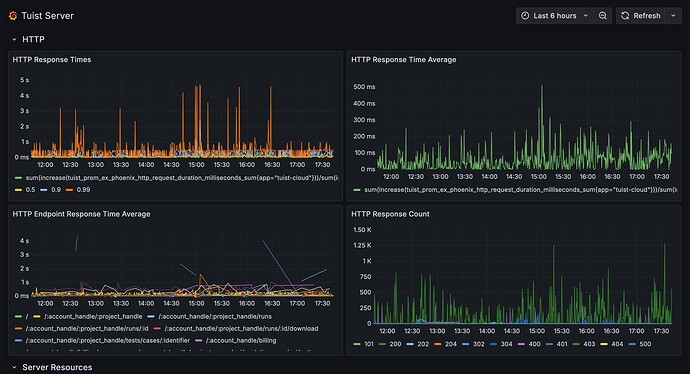
We talk a lot about how we are an open company and we try to put the money where our mouth is – by open-sourcing as much as possible, having an open handbook where we document our process of building Tuist, the company, and now we are also making our dashboard with Tuist server metrics public at our Grafana site:
We don’t want to hide anything from our users, so it felt natural to make our internal dashboard public as well. To check the status service, status.tuist.io has been available for a while, but these public metrics, such as HTTP response times or the CPU load of our server machines, provide extra data points that can help us catch the server stability and performance issues earlier.
Is there anything you’d like to see on our live dashboard? Let us know and we’ll look into it!
